New release · Technical report, September 2026
DoAtlas-2
A causal world model for autonomous scientific discovery
AI can now generate hypotheses faster than science can test them. The harder question is which of them are true. DoAtlas-2 is built for that question: a causal world model of human biology that runs the full research cycle on its own, from asking the question to testing it in real human data.

DoAtlas-2 in 88 seconds: from a map of biomedical evidence to a mechanism tested in human population data. Pathways shown are candidate mechanisms with observational evidence, not established causes.
At a glance
What DoAtlas-2 is built on
Figures as of 22 September 2026. Participant totals are source-reported and not deduplicated across resources.
What makes it different
It tests its own hypotheses, and the results decide what it studies next
Most AI-for-science systems stop once a hypothesis has been generated. DoAtlas-2 carries each one through to a test in human population data and keeps the outcome, whatever it is.
It closes the loop
Questions are generated from gaps and conflicts in the evidence, tested, and the results set the questions for the next round.
It cannot fit questions to answers
The study population, timing, causal estimand and identification conditions are frozen before any outcome is revealed.
It learns from failure
Contradictions, failed tests and analyses that could not be estimated are kept, and they redirect the next round of research.
It shows its reasoning
Every revision to the evidence state can be traced to the result that caused it, with its context and remaining uncertainty.
How it works
One research round, then the next
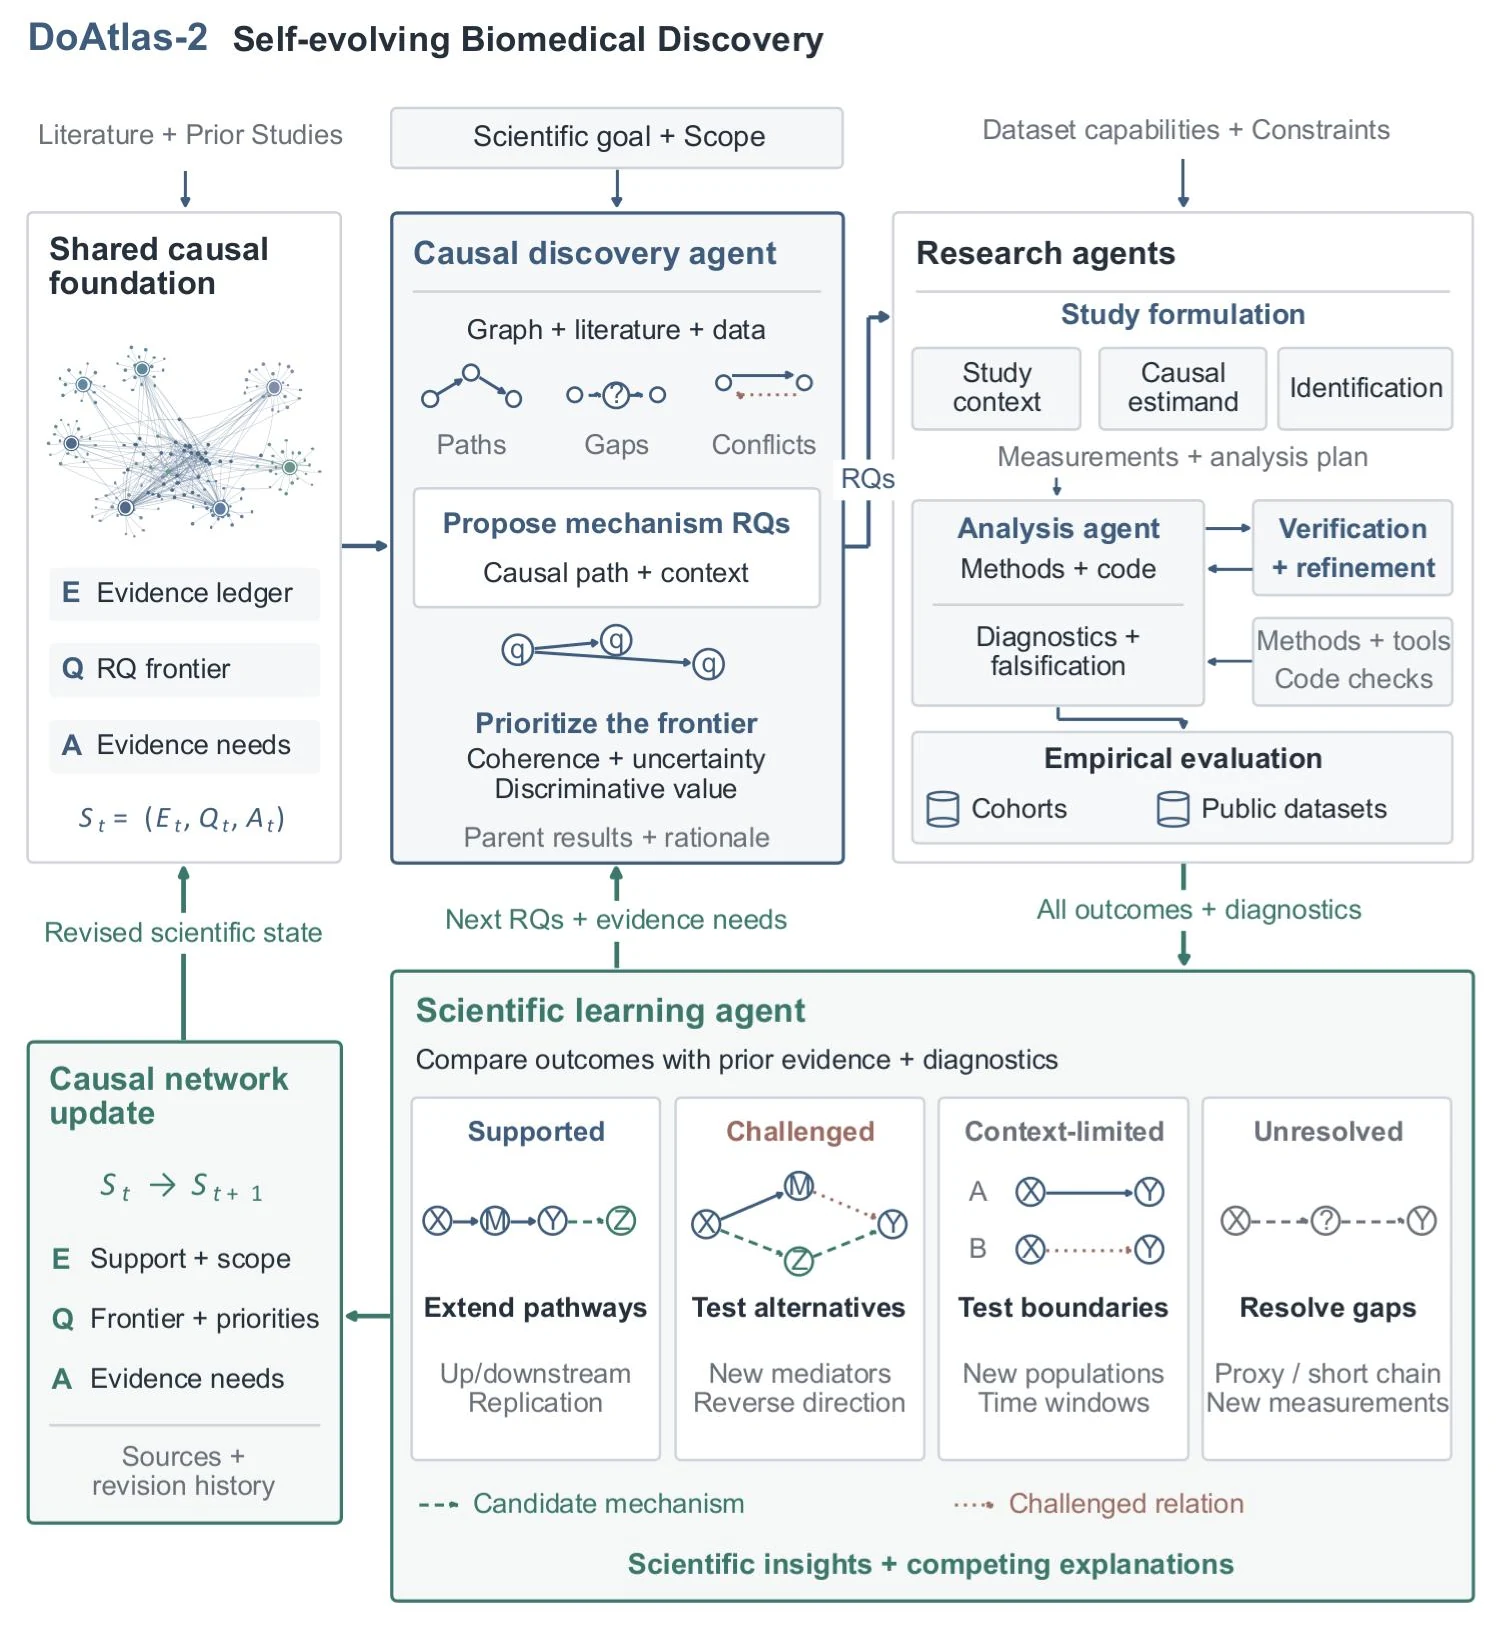
DoAtlas-2 keeps three things in step: the causal evidence it currently holds, the frontier of open questions, and the evidence it still needs. A round changes all three together.
- AskA causal discovery agent reads the evidence graph for gaps, conflicts and unresolved paths, and proposes mechanism questions with the earlier results that motivated them.
- Freeze the designEach selected question is turned into a study: population, measurement windows, estimand and identification conditions, fixed before outcomes are seen.
- Test in human dataResearch agents write and check the analysis, run it on cohort and public data, and report every prespecified outcome with diagnostics and falsification checks.
- ReviseA scientific learning agent compares outcomes with prior evidence and updates what is supported, where, and what to study next.
↻ The revised state is the starting point for the next round.
What each kind of result leads to
Supported
Extend the pathway upstream and downstream, and look for replication.
Challenged
Test alternatives: new mediators, or the reverse direction.
Context-limited
Test the boundaries in new populations and time windows.
Unresolved
Close the gap with a shorter chain, a proxy, or new measurements.
Data foundation
Populations, organ systems and molecular scales in one place
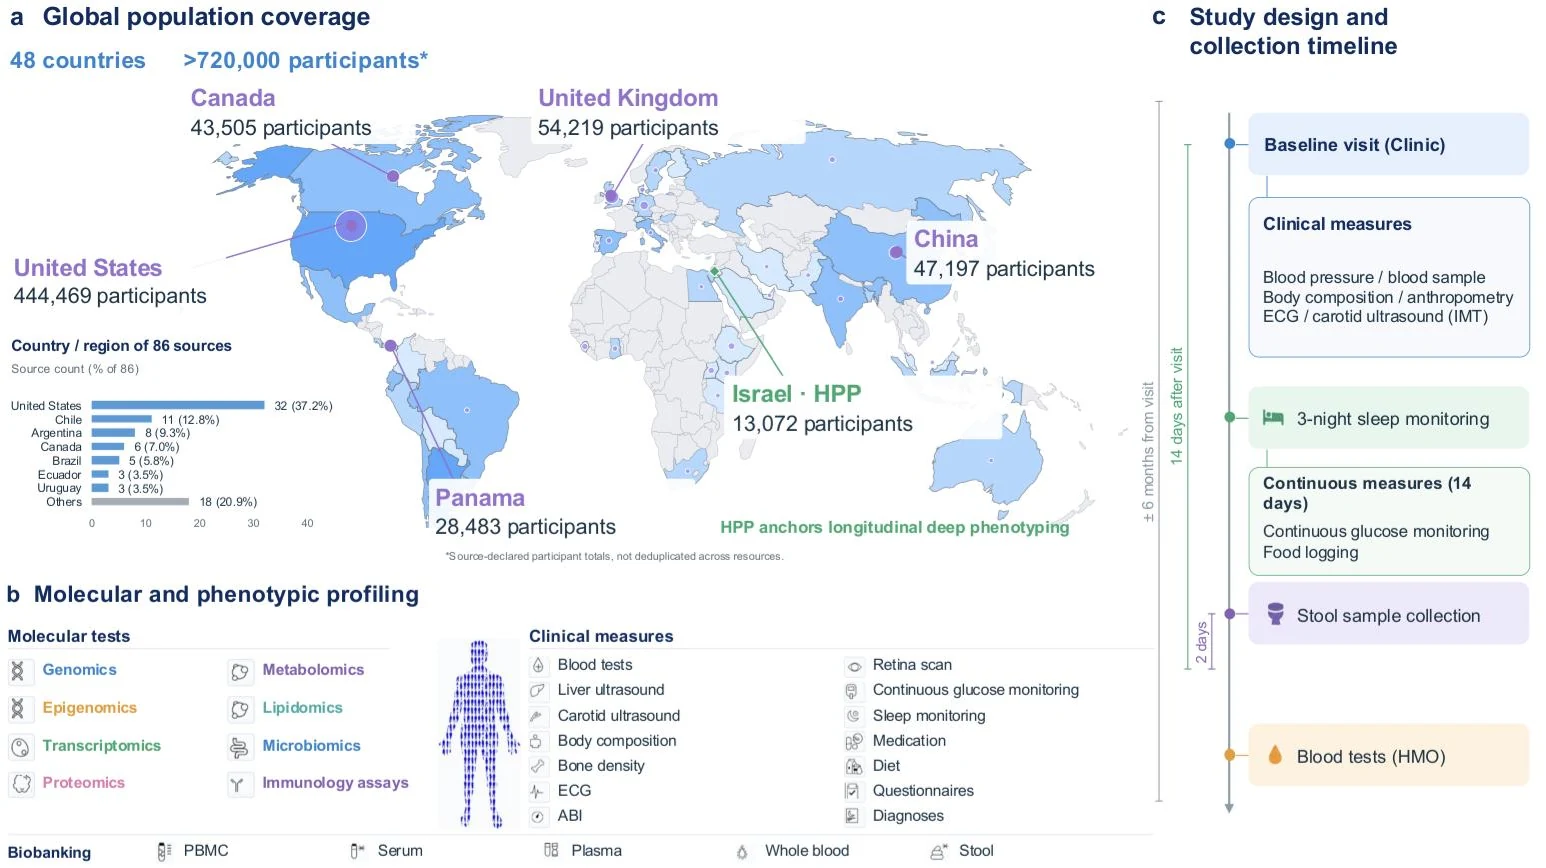
The data landscape brings together 771 research resources covering more than 720,000 participants in 48 countries. Measurements run from population surveys, longitudinal cohorts and clinical records to continuous physiological signals, medical imaging, and eight molecular layers: genomics, epigenomics, transcriptomics, proteomics, metabolomics, lipidomics, microbiomics and immunology assays.
The Human Phenotype Project (HPP) is the core longitudinal cohort. It links long-term follow-up, deep phenotyping and multi-omics at the participant level, and it is where candidate mechanisms are tested and the evidence state is revised.
Inside the Human Phenotype Project
Evidence for the loop
What three rounds of research produced
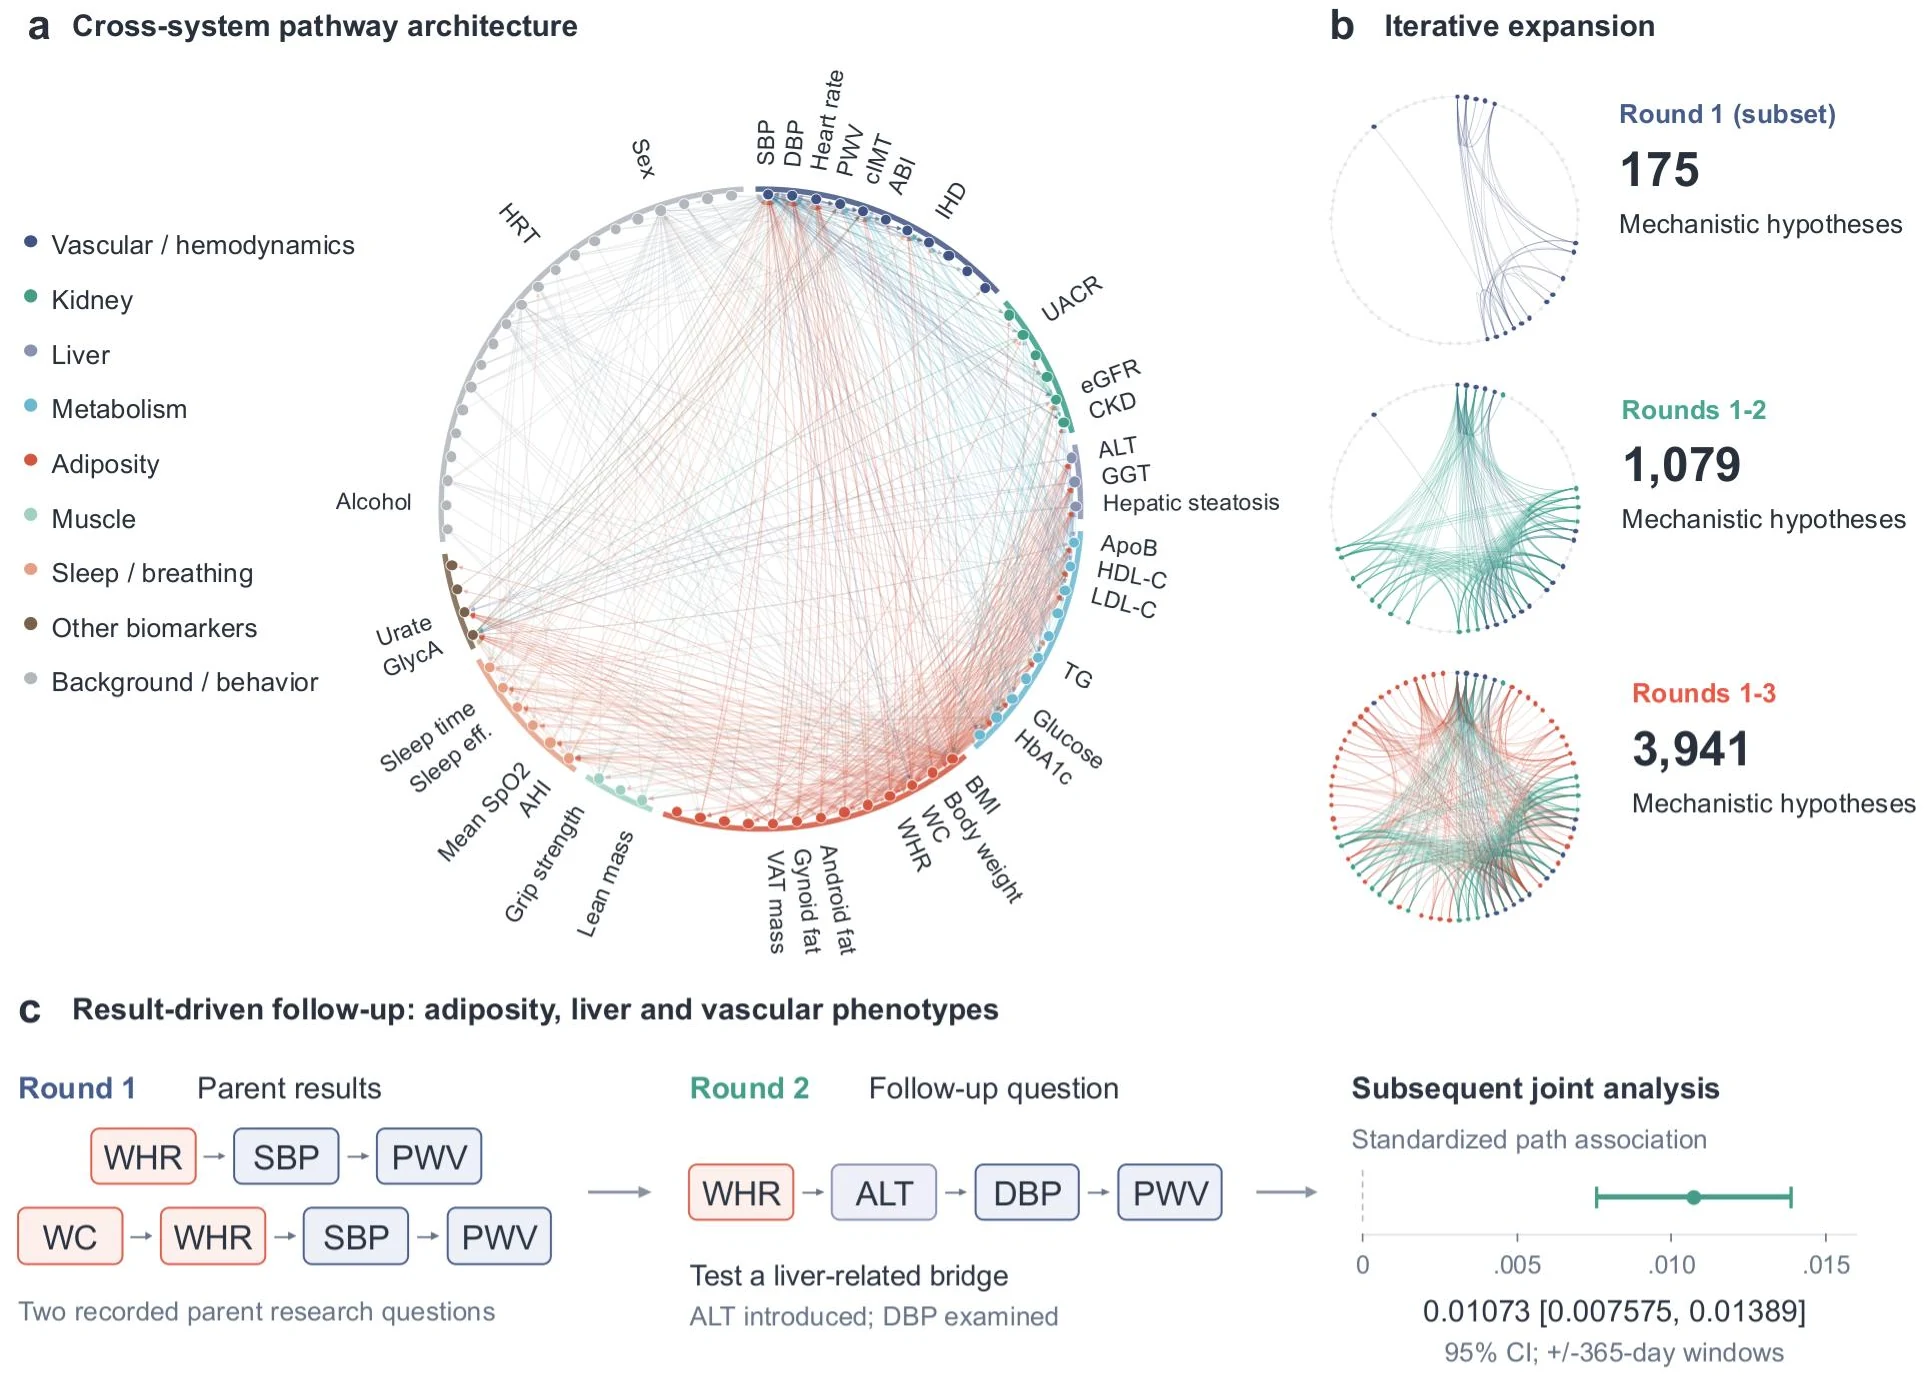
From a research space of 8,724 candidate questions, DoAtlas-2 has evaluated 2,031 end to end, producing 88,731 result estimates. In the Human Phenotype Project the catalog of pathway questions grew from 175 in round one to 1,079 after round two and 4,014 by round three (3,941 distinct pathways), across vascular, early-glycemic and hepatic-metabolic systems. Of the first 1,079 questions screened, 756 received statistical support.
Follow-up questions that held up at screening
All 904 round-two questions trace to a round-one result. Share with screening-level support, by type of follow-up.
Screening is unadjusted and does not set a relation's state; only primary records from full designs do.
Where the evidence stands after testing
200 causal relations acquired a state from population evidence.
- 81 supported
- 2 challenged
- 117 unresolved
The 81 supported relations, against the literature-derived network.
- 49 with no literature counterpart
- 16 match the literature direction
- 16 where the literature is conflicted or gives no direction
Unresolved means the direction is not yet established, not that the relation is absent. Of the 117, 38 are supported in at least one evidence context. These relations form the frontier for the next rounds.
Key findings
Blood pressure links body fat, the liver and lipids to the arteries
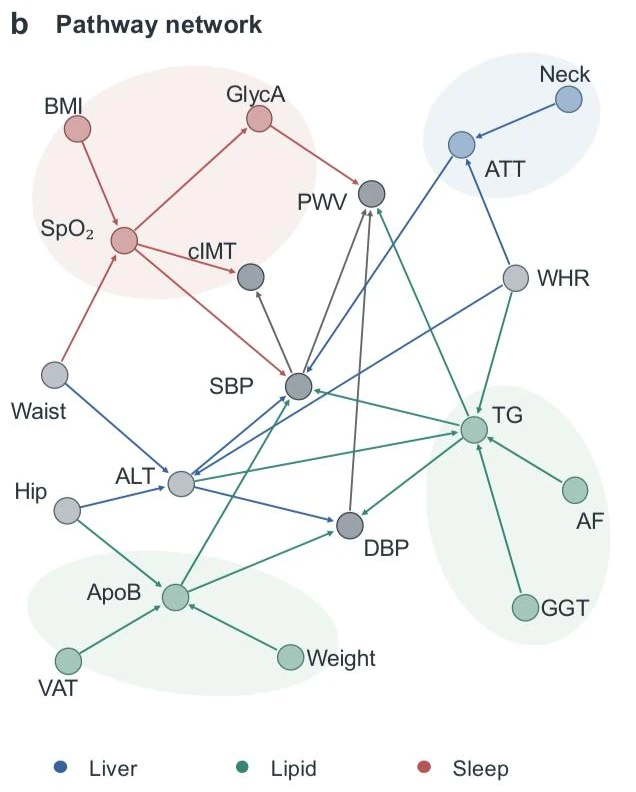
Representative analyses cover 15 pathways with complete serial estimates, forming a cross-system network of 19 phenotypes and 29 connections. Three results stand out.
1. Blood pressure is a convergence node
Liver and lipid branches from adiposity converge on diastolic blood pressure and lower-limb pulse-wave velocity. The standardized path association for the pathway above is 0.01073 (95% CI 0.007575 to 0.01389). In an independent cohort of 912 adults, metabolic-to-pressure routes to brachial–ankle pulse-wave velocity replicate (BMI–triglycerides–diastolic pressure, GGT–triglycerides–systolic pressure, ALT–diastolic pressure and triglycerides–diastolic pressure). In a second cohort of 879 adults, all serial estimates share the same sign.
2. Liver and lipid markers come first
ALT → diastolic pressure → pulse-wave velocity and triglycerides → diastolic pressure → pulse-wave velocity are both supported under strict temporal ordering, consistent with a metabolic-to-hemodynamic sequence. Among ApoB-related sequences, visceral fat → ApoB → systolic pressure → pulse-wave velocity differs by sex, and weight → ApoB → diastolic pressure → pulse-wave velocity is weaker at older ages.
3. One pathway mostly dissolves under adjustment
The waist-to-hip ratio → inflammation (GlycA) → systolic pressure → pulse-wave velocity association falls from 0.01218 to 0.002022 after joint adjustment for BMI and smoking. The pathway reflects overall adiposity and smoking more than fat distribution: a result that narrows a mechanism instead of extending it.
A fourth example shows why the conditioning set matters: higher nocturnal oxygen saturation goes with lower systolic pressure, until waist circumference is in the model, when the association turns weakly positive. Waist circumference is a shared determinant of both.
Why causal
The discovered network is the predictive model
Black-box models give answers without reasons. DoAtlas-2 keeps a traceable causal path and the evidence behind every claim. The vascular network above is used directly as a predictive model: every prediction is an explicit closed-form expression, and every term belongs to a named variable or a source relationship. We see this as a way beyond black-box Transformer and agent-based foundation models, toward causally interpretable AI.
Exact attribution
Each prediction decomposes into node, interaction and branch contributions as an exact identity. Independent recomputation reproduced all 14,079 real predictions to within 1.42 × 10⁻¹⁴.
Closed-form mediation
For BMI → nocturnal oxygen saturation → carotid wall thickness, a BMI contrast of about 22.9 to 28.4 kg/m² gives a total effect of 0.02306 mm: a direct part of 0.02678 mm and a mediated part of −0.00372 mm.
Works with incomplete inputs
With 70% of inputs additionally masked, held-out R² for future pulse-wave velocity moves from 0.378 to 0.248, and every prediction keeps its full decomposition.
Phenotype prediction on held-out HPP participants
| Task | Test n | R² | Coverage |
|---|---|---|---|
| Future pulse-wave velocity | 166 | 0.378 | 89.2% |
| Future carotid intima-media thickness | 172 | 0.176 | 83.1% |
| Liver ultrasound attenuation | 1,380 | 0.155 | 92.0% |
| ApoB | 297 | 0.203 | 93.3% |
| GlycA | 297 | 0.332 | 87.2% |
| Nocturnal oxygen saturation | 1,177 | 0.346 | 90.7% |
Coverage is for nominal 90% prediction intervals. Queried outcomes are hidden from their own inputs. Table 2 of the technical report.
Transfer to a different population: 60-month all-cause mortality in NHANES
| Model | AUC |
|---|---|
| DoAtlas-2 network, relationship parameters frozen from HPP | 0.798 |
| DoAtlas-2 network, refit on NHANES | 0.799 |
| Generalized additive model | 0.798 |
| Gradient-boosted tree | 0.803 |
1,587 test participants, 110 deaths; 95% CI for the frozen model 0.730 to 0.859. NHANES measures 9 of the 19 network nodes. The refit network's differences from both baselines have confidence intervals that include zero.
For researchers
How DoAtlas-2 supports research
DoAtlas-2 is meant to work alongside researchers, not replace their judgment. It takes on the part of the research cycle that scales poorly by hand: enumerating what could be tested, fixing how it will be tested, running the analyses, and keeping an honest record of what happened.
Decide what to study next
A prioritized frontier of open mechanism questions, each with the earlier results and reasoning that produced it, ranked by coherence, uncertainty and how much a test would discriminate.
Start from a frozen design
Each question arrives with its population, measurement windows, estimand and identification conditions, usable as a preregistration-style analysis plan.
See the whole denominator
Every candidate question and its outcome is retained: supported, challenged, unresolved and non-estimable. Negative and null results are first-class.
Stress-test a claim
Reverse-direction, within-person, off-path and confounding-sensitivity analyses accompany the primary estimates, so a pathway can be judged on more than one number.
Know what evidence is missing
When a question cannot be answered, DoAtlas-2 records why and what would resolve it: another data resource, a larger or longer cohort, measured confounders, or an intervention.
Predict with reasons attached
Use the discovered network as a fully interpretable predictor, with an exact contribution for every variable and branch behind each prediction.
Who it is for
- Epidemiologists and clinical researchers: candidate mechanisms with designs and robustness checks to take into your own cohort for replication or refutation.
- Causal inference and statistics researchers: a large, fully recorded set of designed analyses to audit, benchmark methods on, and improve.
- AI-for-science researchers: an end-to-end reference for evaluating discovery systems on whether their hypotheses survive contact with data, not only on whether they sound plausible.
- Cohort and biobank teams: a view of which measurements, populations and follow-up would most change current scientific judgment.
Work with us
We welcome collaborations, in particular replication in independent cohorts, new data resources and methods review. Write to imran.razzak@mbzuai.ac.ae. If you would like to join the team, see the pages for prospective students and research positions.
Open source
Release status
DoAtlas will be open source and available to researchers soon. The first release includes 1,000 research questions with 30,000 corresponding experimental results. Links will be added here when it is published.
| Component | What it contains | Status |
|---|---|---|
| Technical report | Method, evaluation and complete evidence for the key findings (arXiv:2609.35107, 185 pages) | Available |
| Explainer video | DoAtlas-2 in 88 seconds | Available |
| First open-source release | 1,000 research questions with 30,000 corresponding experimental results | Coming soon |
Reading the results responsibly
- Estimates are observational. Pathways are candidate mechanisms tested against human population data, not established causes or clinical guidance.
- Participant totals are as reported by each source and are not deduplicated across resources.
- Screening-level support is unadjusted. A relation's state is set only by primary records from full, prespecified designs.
- The interpretable predictive model reported so far is the first, disease-specific one, built on the vascular network.
Technical report
DoAtlas-2: A Foundation for Self-Evolving Causal Biomedical Discovery
DoAtlas Team · MBZUAI. * Equal contribution. † Corresponding authors. arXiv:2609.35107, submitted 28 September 2026.
Read on arXivPDFDoAtlas Family
@article{li2026doatlas2,
  title   = {DoAtlas-2: A Foundation for Self-Evolving Causal Biomedical Discovery},
  author  = {Li, Yulong and Xia, Rong and Zhang, Yuxuan and Chen, Jianxu and Liu, Xiwei and Xue, Haochen and Li, Maosheng and Liu, Yuhang and Yuan, Yibo and Xie, Yutong and Li, Chong and Su, Jionglong and Rossman, Hagai and Segal, Eran and Razzak, Imran},
  journal = {arXiv preprint arXiv:2609.35107},
  year    = {2026}
}
Updates on what DoAtlas is discovering are coming. Stay tuned.